Performance Curves
Performance curves can be used to track the effect of flow rate on the meter factor or K-factor of the meter using existing proving data. The performance curve is formed by interpolating between selected prove data and can be used to validate any future proves done within a specified deviation criteria.
Configuring a Performance Curve
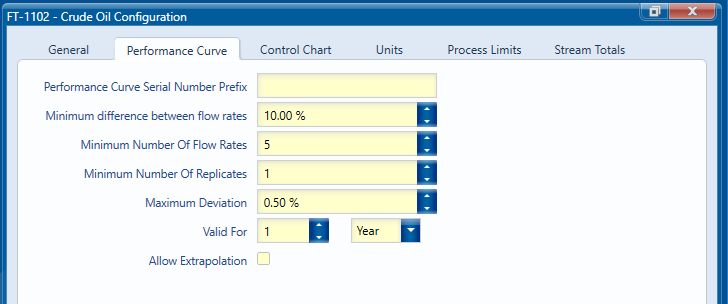
To configure a performance curve select the meter product and right click choosing Meter Configuration. Go to the Performance Curve tab as shown below and define the parameters as appropriate. Note that if 2 or more proves with very similar flow rates are selected the values will be averaged, these proves are what are defined as replicates for the purposes of the construction of the performance curve.
Creating a Performance Curve
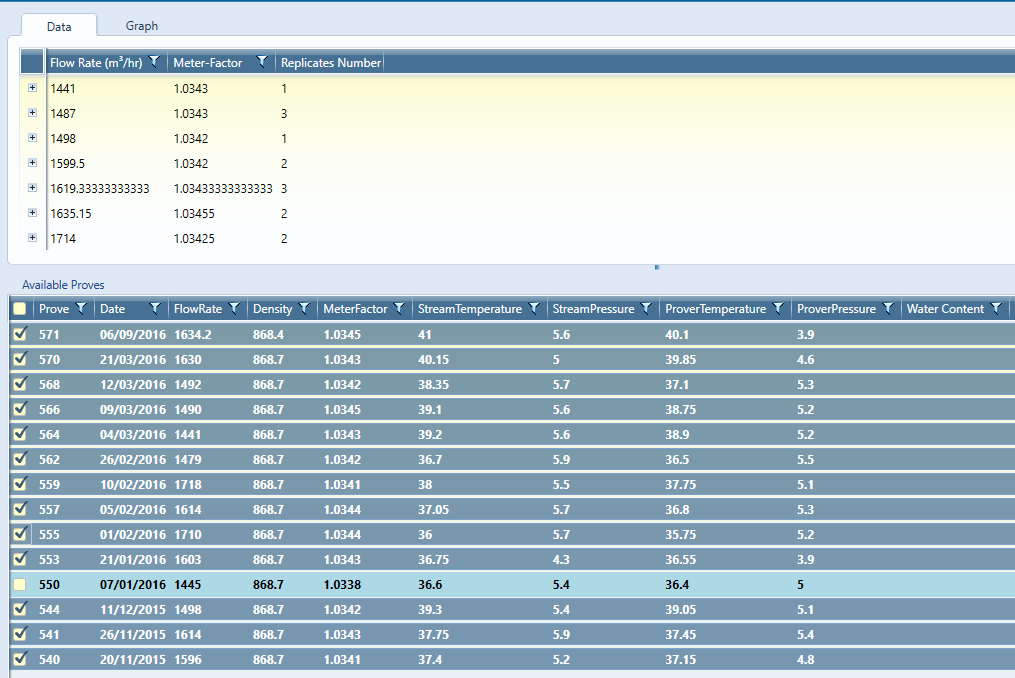
To create a new performance curve select the product and either click the New Curve button on the Home tab or right click on the product and select New Curve. All of the proves associated with that product on the selected meter will be available. Note that only valid proves can be used to construct a performance curve. When proves conducted at similar flow rates are selected these will be indicated by the number of replicates at that data point on the performance curve. The flow rates and meter factors are averaged to form a single point on the performance curve.
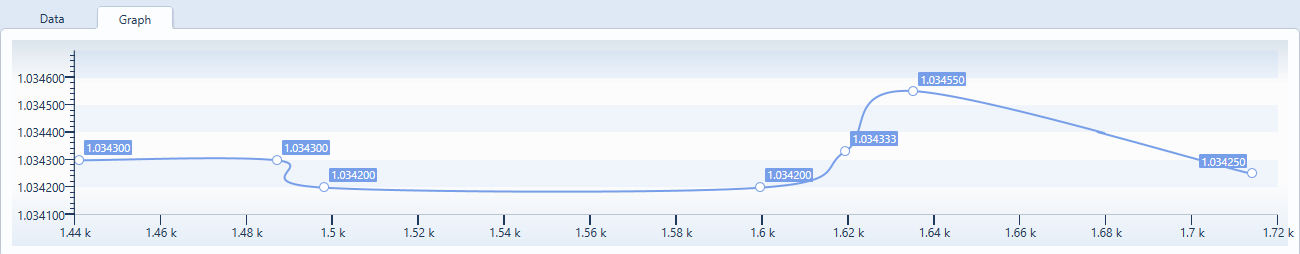
Once all of the requisite proves have been selected click on the Graph tab to view the performance curve generated.
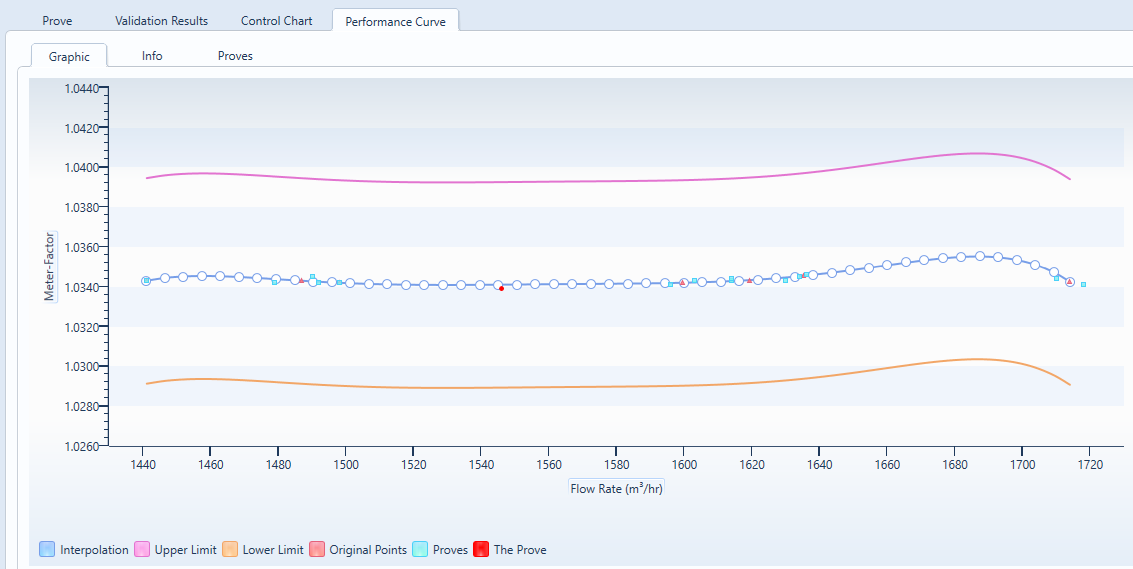
Viewing Performance Curves
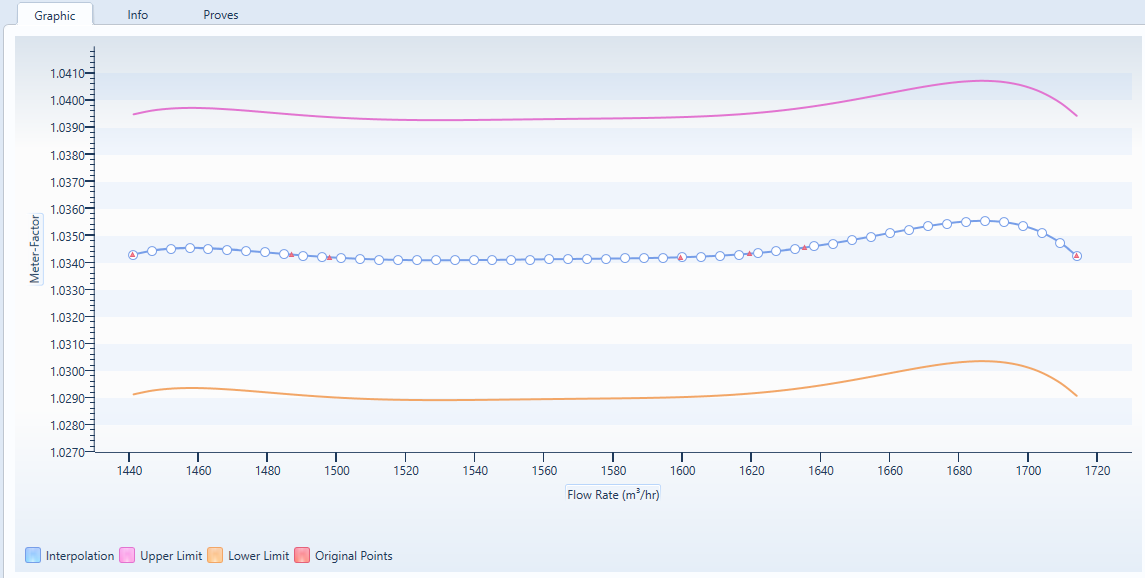
To view a performance curve select the product and then the Curve button from the home tab or right click on the product and select curve and performance curve will be displayed as below.
Validation against a performance curve
To validate against a performance curve check the performance curve check box on the General tab of the Meter Configuration. Deviation criteria, number of points and how long the curve is valid for can be set on the Performance Curve tab. When a prove is done that prove will show as a red dot against the performance curve.
Exporting a Performance Curve
A performance curve report can be generated by opening the Curves available for a meter and going to the Report tab. There a Performance Curve and Lookup Table are available in a report format. The Performance Curve Report generates the performance curve and gives info such as the meter and product used and when the curve is valid to. The Lookup Table gives the points which were used to generate the Performance Curve. Both reports can be exported to pdf or xps file formats.