Control Charts
Control charts can be used to track the performance of a meter over time. There needs to be some historic prove data to create a control chart.
There are two methods for creating a control chart in Meter Performance Monitoring. The first method is to use a rolling control chart and the second is a fixed control chart.
- A rolling control chart will update automatically as more proves are entered.
- A fixed control chart allows the user to select which proves to use to create the control chart.
Creating a rolling control chart
From the meter configuration form select the control chart tab.
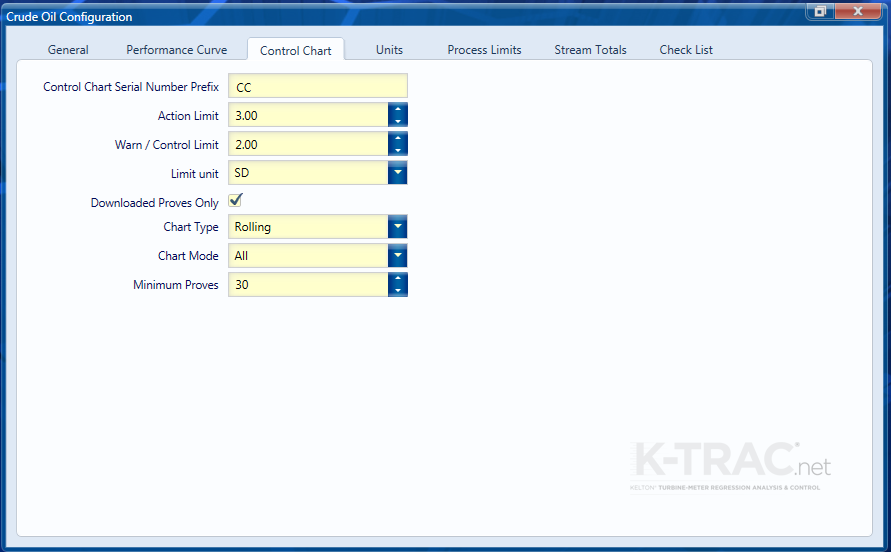
On the chart type drop-down box select Rolling. Now select either All or Range from the chart mode drop-down box.
- All – after the minimum number of proves has been reached the control chart will be created using every prove in the database.
- Range – lets the user define a minimum and maximum number of proves to create a control chart.
Creating a fixed control chart
From the meter configuration form select the control chart tab.
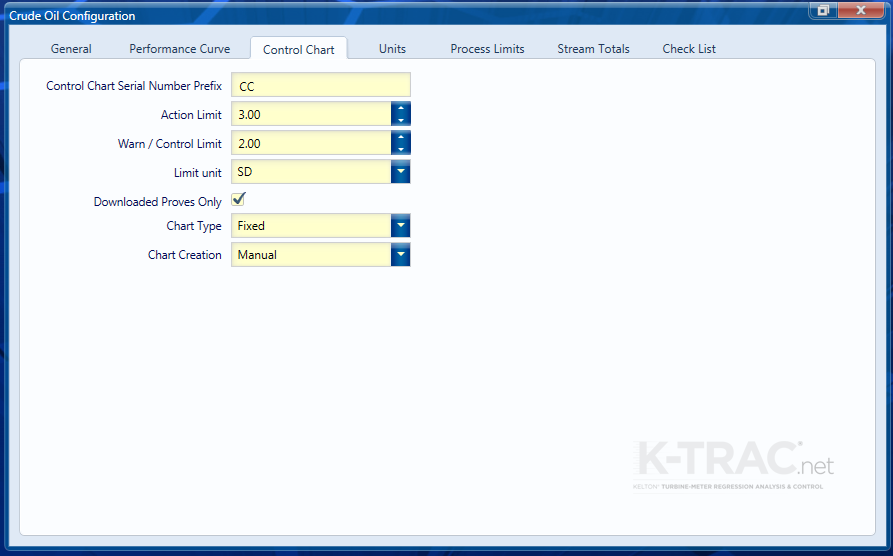
On the chart type drop-down box select Fixed. Now select Automatic from the chart creation drop-down box. Close and save the meter configuration form.
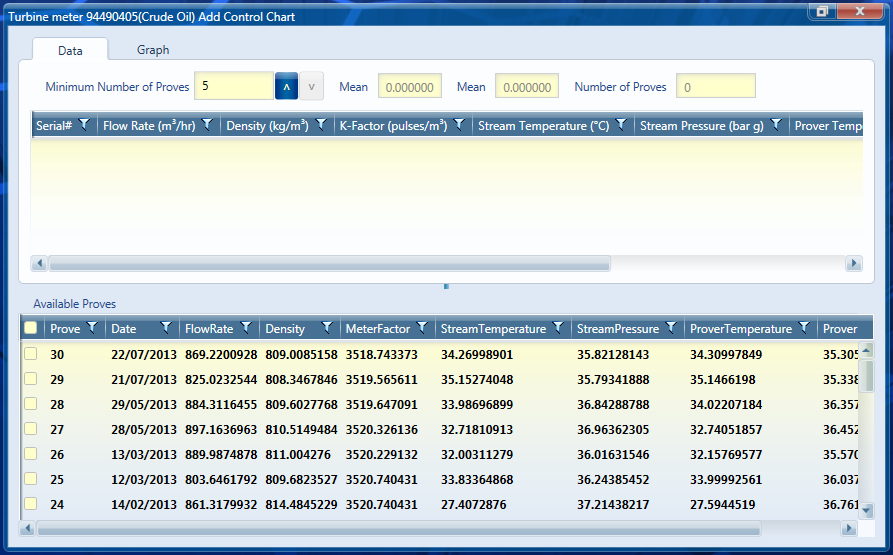
From the home ribbon select new chart. The control chart creation form will open